skip to main |
skip to sidebar

- Sentiment isn't at extremes it's seen over the past 12 months. Which is supportive of some possible additional upside. Especially into the beginning days of the month, when mutual funds get all that "automatic" IRA money and then have to put it to work...after prices have conveniently been marked higher by "Da Boyz".
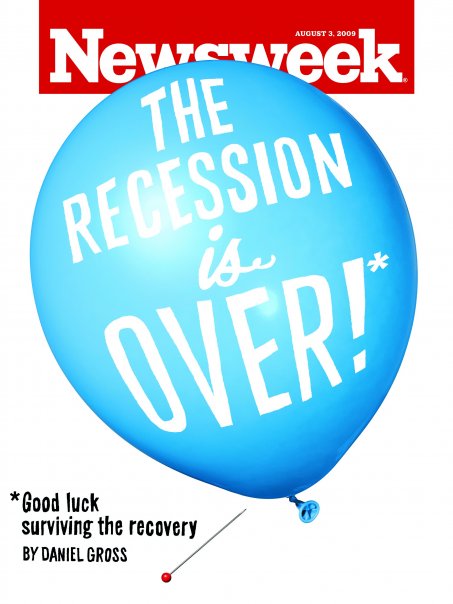
- Although, the old "magazine cover" indicator is kind of interesting here. Note the asterisk and what it stands for.
- The magazine cover indicator is kind of interesting for contrary opinion. It goes like this...when some big trend in the economy finally makes the cover of a main stream magazine, that trend is probably over or about to reverse. Afterall, economics are boring and it takes a lot to make a magazine cover as "the" story. For example: remember the guy hugging a house on the cover of Time with a headline of "Home Sweet Home"...came out right about the top of the housing market. I still remember one back in March 2002 on US News and World Report...a big bad growling grizzly bear face filled the cover just before a spirited bounce.
- If you see a bull goring a bear on a cover...antenna up!

- Above is a chart of inflation adjusted SP500 earnings since 1935. Investors typically buy stocks when a company is showing good earnings or has some new innovation which will improve earnings over time. Well, I guess you could always say "It can't get much worse."
- It's information like this that has me rubbing my eyes and looking at this recent rally and saying, "Huh?" But then again, that's economic fundamentals information and the stock market doesn't always reflect it. When Ms. Market wants to party, she will! And if she parties too hard and gets a hangover, you don't want to be anywhere near her.
- Soooo, I just take a step back and look at the bigger picture for perspective. FACT: It took 2 years for the SP500 to lose 57%. FACT: It's taken a mere 5 months to gain 47%. FACT: The inital down move in 1929 was 49% followed by an approximate 6 month rally of 52%. (Click the link to see a price chart from that period.) Then, more downside followed. FACT: Huge rallies often follow huge drops. OPINION: I do not think this is a new bull market. Instead, it's been one of those huge "bounce" rallies. The earnings picture, unemployment situation, excess credit/debt overhang and prospects of big tax hikes to cover enormous federal deficits don't provide the underpinnings for a solid recovery, yet.
- That 1929-1932 chart gives me a very healthy respect for Ms. Market. She is not one to toy with. My personal opinion is that our 1929-1932 crash may have been the 75% Tech Crash 2000-2002....Perhaps, we're more in a situation like this 1937-1942 chart. In the 1937-38 period, the Dow experienced a drop of 51% followed by a 7 month rally of 59%. If we're in a period similar to this, I still respect that we may be moving in to that 1938 peak with this recent straight up move. Then, more downside followed.
- In both instances, you'll notice the similarities of the moves: ~50% down followed by a half year rally of ~50%. Hmmm...where are we now? Similar spot...down 57% and now up 47% in 5 months. Not saying it'll go that way, but I really really do not trust this market and I'm watching it very closely.
- The booming markets of 1982-2000 are over. You can no longer just "set it and forget it". Instead, you have to be a little more thoughtful and active. Throughout history, the stock market has demonstrated two types of environments: 1) slow steady upsloping prices and 2) basically flat action but huge up/down swings contained in the wide "flat". As you can see in the picture at the bottom, these environments tend to last approximately 18 years and they alternate. You'll notice the type of environment we are in now.

- The current rally is a gift to those that rode the market all the way down. It affords an opportunity to take a smaller loss and to raise some cash by exiting completely or even 50%. That way, you'll have cash to redeploy at a future opportunity. These are very personal questions which everyone has to ask and answer for themselves occassionally. Some will choose to "just ride it out." I merely hope to provide some "background history" so that you can make more informed decisions.
- Finally, I never, ever, ever chase a move. Those that get to the table late don't get to eat and just end up doing the dishes.

- Dow above 9,000 this past week. Gee...guess it's time to celebrate. Not so fast Jethro.
- As discussed in the 9 JUL blog entry, it appeared that there were becoming a few too many "retail" bears way too fast on the price drop in early July. Thought we could see a decent bounce but, I admit, I didn't think it'd move anything like this...SP500 up 12.3% in 10 days??? Holy raped ape, Batman. One thing that the markets have demonstrated these past few years is to "expect the unexpected!"
- I was waiting for this recent rise as a potential opportunity to enter some short sales. I waited patiently for it to come up...waited...waited...then pounced! But it just kept scorching upward so I was forced to buy back the position, take the loss and lick my wounds. Now, I'm waiting for my next opportunity. Many trading blogs I read are all saying the same thing...technical analysis isn't working right now. Well, neither is entering trades based on economic fundamentals. It's something to behold. Is there more? Or is it on an exhaustion run? Dunno...I'm watching price levels (Support and Resistance) for clues. Straight runs (either direction) like this are always tough. Could be more upside after some correction or consolidation but, to me, this is getting stretched because I don't see the economic fundamentals have changed sufficiently to support it.
- Sure feels like a pump to the next level to get everyone feeling..."It's getting away from me!" People will do the darndest things when emotional and "Da Boyz" know it. Think of it like this: retail guy is the fish, "Da Boyz" are the fisherman. "Da Boyz" go down to the lake, toss in the lure, see the fish going for it and tug it back a little. The fish sees the "meal" pulling away and charges it only to have the fisherman pull it away again. This goes on for a bit until the fish is determined to "get it this time". Oh, and he gets it...hook, line and sinker...much to the fisherman's delight.
- It's going up again as proven by this recent breakout to new highs for the move. Be careful out there. Geez, I worry too much...but staying alert has always aided me.
- SP500 Resistance: 1010, 1050, 1100, 1130...(to infinity and beyond?)
- SP500 Support: 940, 910, 870, 830...(to the Abyss?)
- Government revenues are getting hammered at all levels.
- First graph shows change in sales tax revenues for states. The consumer has closed his wallet which means that the already struggling states will have to make deeper spending cuts and/or raise taxes and fees (another word for tax) to fill the holes in their budgets.
- Second graph shows Federal income tax withholdings which automatically come out of people's paychecks. With a drop that steep, it indicates that a lot of paychecks have disappeared due to the high level of unemployment. So again, reduced spending (yeah right) or increased taxes.
- Simple question...why are the Feds on the biggest government expansion binge in history? This demonstrates the sad "Overdrawn? How can I be overdrawn? I still have checks!" mentality.
- The Usual Suspects...


- Sooo...how exactly does Goldman Sachs make $4 billion in 3 months (click link). They do it through what's known as "High Frequency Trading" via a couple of supercomputers constantly swapping orders back and forth in milliseconds to raise or drop prices to where they want.
- The problem with this? Hmm....didn't they get TARP Money (recently paid back), get more TARP money that was funneled to them through AIG as a payment? Our tax dollars are the backstop for this?
- Another thing, didn't they have to become a bank when they verged on implosion? And who backs banks? FDIC??? Your tax dollars at risk again...especially if this all goes sour because then you'll make good on their deposits. Reminder: After the 1929 Crash, Glass Steagle was a law put into place to stop commercial banks from trading because many banks were destroyed. Ahem, that law was repealed under the Clinton Administration. Deja vu?
- You should be scared....this reminds me of the mindset of 2 particular periods that were gut wrenching when they failed...the computerized Portfolio Insurance prior to the 1987 Crash and the Computer Modeling by Long Term Capital Management in 1998. Neither ended well as I recall. In both instances, the precepts of the computer models failed miserably because the programmers planned on normal trading environments with no sudden shocks. When the sudden shock did happen, the computers dutifully went about doing what they were programmed to do at a faster and faster pace, with more and more leverage, until...BOOM! Thing is, that the humans trust their programs to the bitter end. However, at some point, all machines fail and require human oversight / intervention.
- Predicition: If there's a sudden shock, the subsequent crash will be blamed on HFT. Then the headlines will be "The end of the financial world" which will then require more bailouts. Seeing a trend here? The US Taxpayer is slowly but surely being robbed in the biggest bank heist of history by guys in suits, not ski masks.
- Oddly enough, Friday 17 July 1998 was the closing high before LTCM went poof...and it happened after a straight up run like we're having now...maybe it means something, maybe not.
- UPDATE: 24 JUL... HFT is a Scam!

- Above chart demonstrates that auto loans, home and home equity loans, and credit cards are at record delinquency rates.
- Americans simply borrowed and spent way too much during the halcyon days of the early-to-mid 2000s. They were counting on ever-rising home values to bail them out from high-risk loans. The lending industry actively egged them on, as did policymakers at the Fed, who kept interest rates too low for too long. And now, the "debt hangover". OUCH!
- Who can buy anything if they're doing all they can to pay off loans? Where will the consumer come up with the dough to power the economy?
- This is not shaping up as a typical recession.

- Interesting...in the recent stock market pullback, bearish sentiment has raced to it's highest level since the March bottom. Other indicators are getting short term oversold as well. Perhaps we might get another push upward. The question is how much? Back toward the recent highs and fail or breakout above? The 55% bears area has been associated with bottoms in the past. It can be either a short term bounce or a long term move and that is why it's important to watch subsequent price action for clues.
- Per normal, Ms. Market does everything that she can to hurt the most people. And, she is making it very confusing since the end of May...a little something for both the bulls and the bears. Which side is she setting up for the longer term slam? Don't know...day by day...but I've got my ideas.
- As I've said, we are in a long term bear market. A guide for that is the 60 week moving average that you can find on the weekly charts. Above it, long term bull...below, long term bear. NOTE: It's a guide, not an answer. You can also use it as guide when you get really extended away from it...possible corrective return move toward it pending.
- I'd like to see the push a little higher so I can establish shorts at better prices...but will be trading both sides, as necessary, until this sorts itself out. Short term, I watch the 30 & 60 day moving averages as guides on the daily chart. When I'm bullish, I'll be looking to buy weakness as prices retrace toward them. And when I'm bearish, I'll be looking to sell strength as prices retrace toward them.

- Happy Independence Day!!!
- Ban on short selling again? WTF??? Government..."Get out of my way!" They must be afraid of something...what is it, what do they see that we don't?
- One of the factors that the lawyers at the SEC don’t understand is the importance short sellers play in cushioning collapses. A brief excerpt from Barry Ritholtz's Bailout Nation: “In September 2008, with the crisis in full flower, [SEC Chief Christopher] Cox made shorting financial stocks illegal. Apparently, he was unaware that fierce market sell-offs often end with short sellers covering their positions, locking in profits on their bearish bets. With short sellers out of the market, the downturn became even fiercer. From the market highs of October 2007, the S&P 500 and the Dow Jones Industrial Average were cut in half in 12 months. Much of the damage came after the no-shorting rule went into effect.” Don't believe it? Click the link and look at the chart. As you can see...it was a very swift 34% decline over the 5 weeks following the short sale ban and eventually led to a 47% decline from the ban into the March 2009 lows. Shorts are a shock absorber!
- Were Bear Stearns, Lehman, Merrill Lynch, GM and Chrysler solid companies wrongfully "attacked and brought down" by the shorts? No! They were being shorted because they were badly run companies which were already bankrupt...the rest of the world just didn't know it yet. Now they do.

- Percent job loss rate comparisons by post WWII recessions.
- It's really ugly out there.
- Perhaps we're reaching the trough point where it will moderate some? Or, put another way, "They can't fire everyone. Can they?"


