skip to main |
skip to sidebar
- How's about that global warming! George Carlin lends some perspective to the "Save the Planet" initiatives.
- WOOHOO!!! Last 2 trading days for the year 2010! It's been a pretty wild one with multiple straight line moves with precious few pullbacks to safely get on board using a day to day pullback strategy. Extremes have persisted longer than normal and retracements are much shallower than in the past.
- Heck, even had a Flash Crash thrown in there for chuckles. Active trading became my method of choice after that period due to anticipated higher volatility...worked for me but it is a lot more work and I hate having to monitor the overnights so much. Feels like having a baby in the house...ugghhh!
- A pretty weak Hindenburg Omen mid August (4% loss) and currently on another active Hindenburg Omen since mid December.
- Most of the volatility has been completely wrung out as the VIX has dropped down below 20. Hopefully, that will permit more of a swing trading type of environment.

- Above, from shadowstats.com, shows government reported Consumer Price Index (CPI) in red.
- But the government has changed the way it calculates the number 3 times since 1980. Each time it has changed lower inflation rate occurs. What a coincidence, lower CPI = lower COLA's for Social Security and pension benefits, which means the government can effectively reduce your benefit by paying you in more dollars but they're worth less. It's all an illusion...that's what politicians do to placate the great unwashed. Pretty slick, huh?
- The blue line CPI, in the chart above, reflects a CPI without the government changes...which probably addresses why you feel a dollar just doesn't stretch the way it used to.
- Now, remember that Fed Chief Ben Bernanke doesn't think that we have enough inflation currently and his QE programs are designed to increase the inflation rate more.
- If he succeeds, we are forked! The mad man must be stopped...and by the way, this is the same man who repeatedly said "sub-prime is contained" prior to the recent economic crisis.
- I still think that we've another deflationary period prior to inflation taking hold. Apparently, Bernanke agrees because he is doing absolutely everything he can to prevent it...No?
- Now to more important things...hasn't the recent snow been absolutely great?!!

- 234 years ago today many brave and dedicated men were crossing the frigid waters of the Delaware River to turn the tide of the war effort. As we move forward, let us remember their sacrifices made to hand us an incredible gift...the United States of America. Let us not disappoint them by not protecting their dream of independence and self-governance.
- Just so I can find it later...Citibank put together a few periods in stock market history that look similar to the current one. Interesting.
- White collar crime pays! This is just a recent example of what has been happening all year long. Laws and jails are for the little people...What crap!
- Alright, I know I said few posts...but this one is so I can search for this data in the future.
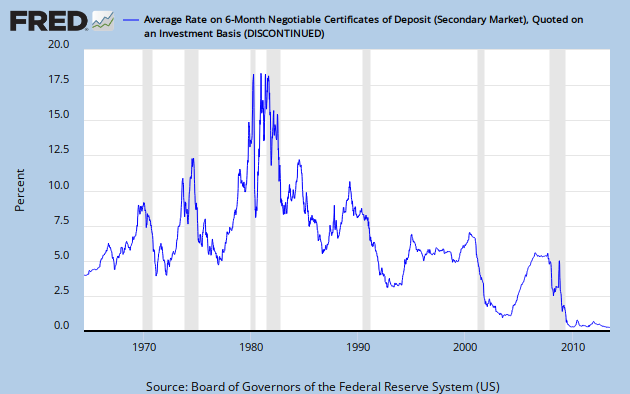
- Above shows interest rates on 6 month CD's since the 1960's. This is a very short term interest rate (which the Federal Reserve controls).
- Elderly folks try to live off the income from their lifetime of savings. Only thing, right now savers are getting totally forked. On top of that, Bernanke is trying to inflate which will further destroy the savers, if he succeeds.
- Soooo, this cheery holiday season, if you see some older folks in need...help them. Please, help them...
- ...because Ben Bernanke could give a flat rat's butt about them...his actions prove it. Disregard his words.
- I guess he's single handedly trying to solve the Social Security / Medi-scare problem, too, by "thinning the herd".
- Thanks Ben...you're a peach!
- There are more important things to remember this Christmas season...may you and your family enjoy peace, love, happiness and good health as we move toward the New Year 2011.
- Entering into the lowest volume / activity period of the year. Don't expect much in either direction until January. Currently, it is up but basically went nowhere in the last 5 days. Review posts below to see what bothers me about the current market.
- Sooo, I'm going to take a well deserved break and enjoy this slow time of year. I am on the sidelines and will sleep well. Posts, if any at all, will be very brief.
- Ooops...there it is! Second Hindenburg Omen strikes confirming the first.
- Today, my very short term (trader) indicators indicated short for the first time in weeks. But, they can flip quickly so it serves as a warning to me to be very alert.
- Its back...the Hindenburg Omen just made it's first appearance. It needs two to be confirmed. More info in this August post. Will post additional sightings to confirm the first as they come or not.
- Of course, August's signal didn't fare too well. So, nothing is a lead-pipe cinch guarantee. Especially, when it comes to markets...there are none. Perhaps it was because the market had already gone down since early May and was just bouncing around on the floor for awhile. OK...cool. I'd never watched the thing before so I'm learning as I go with it. I've got to look into the past examples and see if that had something to do with it.
- But this time is different, and will be even more interesting to watch, since the market is hitting multi-year highs at the same time the Hindenburg Omen reappears.
- Good luck out there!
- Aaahhh...dare to dream! Is equal justice under the law even possible any longer? Or is it called white collar crime because they're the good guys??? Failure to prosecute fraud will only prolong our economic woes. Unfortunately, that seems to be the path our leadership (if you can call it that) has chosen.
- Now...where are we?
- Above from http://www.bespokeinvest.com/. White line is the 50 day moving average, bottom of red is 1 standard deviation, top of red is 2 standard deviations and black line is SP500. I'll put a similar chart to this on the sidebar. Currently, I have one over there called SP500 Daily w/ Envelopes in which the red Keltner Channel is the longer term one (similar to the 2 Std Dev above) and a much shorter term green one.
- Above is the difference between percentages of bullish and bearish newsletter writers from Investor's Intelligence. Lots of bulls and fewer bears out there.
- Above, again from http://www.sentimentrader.com/. They track a lot of different sentiment indicators and the chart reflects the percentages of bullish, bearish ones and the spread between the two.

- Above, speculative call (leveraged for the upside) buying is at extremes. Past examples are also highlighted courtesy of http://cobrasmarketview.blogspot.com/
- SP500 fundamental valuations never really got shellacked like in a big bear market but that hasn't mattered at all during this upswing and they are currently factoring in "paradise is here" again, it seems.
- You can check other charts in the sidebar.
- All of the above doesn't mean it's necessarily going down. This market has proven that it will do whatever it wants to do. As it should be...since price is the only thing that matters. We just pick our direction and see how it works out. And afterall, there's always the Santa Clause Rally!
- However, if you are a monthly dollar cost averaging Buy and Hold Investor, I'm just trying to highlight that there are times to add and there are times to wait to add.
- Levels I'm watching...1245 (there now), 1290, 1310 to the upside. To the downside, the recent November low at 1173 is the immediate level that must hold.
- As to me, again, I do not trust this market and will continue to defensively trade it, only. Especially, when it gets into the overbought areas highlighted above.
- I still think we're in a Secular Bear market and this upswing is a Cyclical Bull move.
- The only thing, I'm interested in holding will be a downside position when the time comes...possibly getting close (note levels above). Tried in OCT 09 got stopped out, in JAN 10 did OK, APR 10 did good until I tried to get cute and buy too early (on the day of the Flash Crash as it just so happened) still did OK. After the Flash Crash I went into trading mode, because I anticipated a higher level of volatility, and have been there ever since. Glad I did because the market hasn't made a lot of sense / trades differently since then...at least to me!
- Back on NOV 4, I talked of SP500 1220 & 1245. Well, It's looking like it wants that 1245.
- Anyway, still up. Holding above the April highs. Drew a tentative overhead trend line.
- Bullish sentiment is still high which means higher risk. So, just be aware. MACD is currently in a negative divergence but that could be corrected with further price action.
- After 17 DEC, the holidays will be a low volume trading environment. Probably won't be much to say.

- Congress is outta control...
- The message from the electorate of "Be more fiscally responsible" has already gone to vapor!
- Don't tread on us!
- Market broke sharply up out of the sideways area. Got back up over the April highs (cyan line) again like in early November. Price above all moving averages. Will it surge higher? Time will tell.
- Just trading this beast "One day at a time" and sleeping much better not worrying about the overnight nonsense that has been going on.


