27 April 2010

27 APR 2010, Tuesday


  • Think that Goldman Sachs is trying to tell Congress that "If you mess with us, we'll turn off the HFT computers and the faux rally we engineered this past year is over."  (Or is that yellow trend line exerting influence...twice now.)
  • The 2 vertical orange lines highlight when GS was charged by the SEC and then, today, was hauled before Congress.
  • Coincidence?
  • Also, as warned in the 13 APR post, Greece debt downgraded to junk today.
  • Which is it?  Dunno.  The risk has been high and is looking for triggers...negative surprises.
  • Still up, although starting to appear sideways, didn't break the previous pivot (black line) yet.  Tomorrow, the FED makes its release on interest rates after it's 2 day meet.  Always provides some excitement.  Which way?  Dunno.  Do they save it here and drive it back up?
  • After as strong a run as it has been, it could still go back up again.  Wouldn't surprise but could set up larger divergences.
  • Anyway, I'm watching how this progresses. 

26 APR 2010, Monday

  • This is all pretty simple...why doesn't government see it?
  • In inflation adjusted dollars (so it is an apples to apples comparison), look at the spending trend in government at all levels.  Remember this as you think about the tax hikes passed in the healthcare bill, the upcoming Bush tax cuts expiration and now the talk of more taxes via a VAT and Cap and Trade.
  • It's not that you're taxed too much...it is that we spend too much.  Reduce that and you won't need more taxes.  Simple huh?
  • And if we don't reduce spending (which seems to equal borrowing these days) on our own...as adults in government, then the increased interest costs will force us to.  Either that or we will be reduced to a "new feudalism" where we peasants work for the elite and whatever they desire.
  • I didn't sign up for that and I don't want my kids and grandkids forced into it either.
  • Why is this so difficult?  What am I missing?


25 April 2010

25 APR 2010, Sunday


  • Well...they shrugged off that Goldman shock from last Friday continuing upward to make new highs.  The lift in this market is something to see.  Last time we had 8 straight up weekly closes was NOV 2003-JAN 2004.  Then the market went sideways in a 10% range for most of the year until the fall. 
  • Made it to the 61.8% Fibonaccic retracement (SP 1228...brown line on weekly) where the 200 week moving average is.  Also, it is the bottom of a 2008 congestion area that formed just prior to the collapse.  Will be interesting to see how it handles that broad price band.  
  • Time to rest or is it on a mission?
  • Sentiment by the newsletter writers has gotten very bullish which can be a contrary indicator...but not precise in timing because it can stay that way for awhile.
  • Then there is always the magazine cover as contrary indicator...below, the Barrons bull splat cover came out 9 MAR 2009 (the bottom basically).  This week a bear splat cover.  Will it have similar implications?  The timing is often uncanny...time will tell.
  • It is still going up!  Again...as for me, I don't like the risk for the return potential.  Many indicators are once again at levels that have signalled for caution in the past.  So, I listen to them and play defensively.   

24 APR 2010, Saturday


  • Change?
  • Most Americans agree to help those in true need through temporary hardship.  But where do you draw the line?  Is there a line any longer at all?

18 April 2010

18 APR 2010, Sunday


  • Well, Goldman gets a surprise and the market, too.  Appears that the yellow trendline (from 12 APR post) acted as resistance as well.  At least the market finally exhaled instead of non-stop inhaling.  It's just one day.  Will be interesting to see how it behaves now.
  • A few daily pivot lows to watch for how price reacts for clues.  Will the JAN highs at 1150 act as support is probably the true test.  Seems the 50 & 90 day moving averages will be right about there soon too.
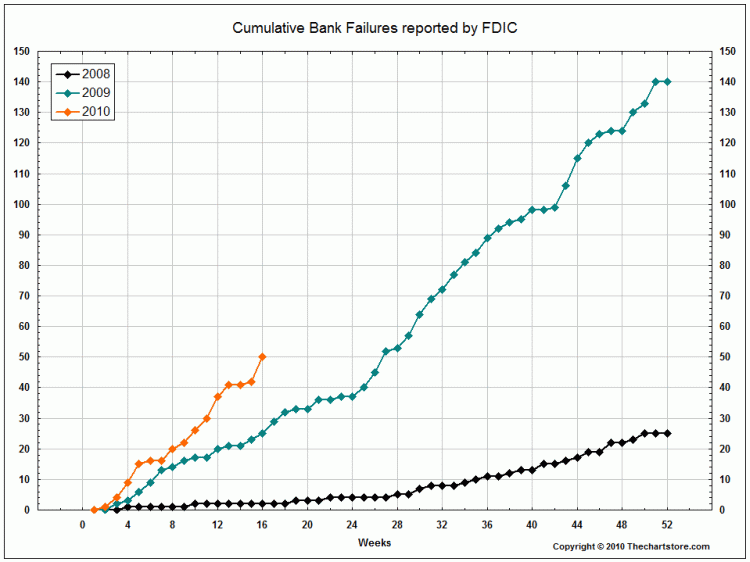
  • Below...banks ...OUCH!


14 April 2010

13 APR 2010, Tuesday (Part 2)

  • Now...either the banks are suddenly lending $400 billion this last week when they haven't been lending for some time OR....the Federal Reserve is preparing money for a bailout...a BIG one!
  • Saw this yesterday at Market Ticker and didn't know what to make of it.  Read the short post here.
  • Then I saw this IMF Press Release tonight...IMF Boosts Resources for Crisis Resolution.
  • It appears that may be where the money went...perhaps.
  • Huh?  Our leadership is telling us all is good...no?  I do not trust any of this crap.  Is it possible for governments to prop up assets worldwide forever? (Read the first 13 APR post below for an opinion)  Crazy stuff....crazy times.  Next shoe to drop?
  • So, is the money for the on again, off again Greece bailout?  Or to bolster the European Union after a Greece failure starts some dominos falling?  Or maybe just some walking around money for the IMF?  Or, I know, I know...China is going to suddenly have a fake implosion and this is how they get their money back from us laundered through the IMF under the guise of a crisis?  Alright, now I'm just getting silly. 
  • I honestly do not know and I honestly do not care.  I am hunkering down and will let not quibble about any remaining nickels or dimes that may be left in this most recent upmove.  It is still strong...but eerily quiet in it's slow drift upward...and very stretched...just as Dow hits 11,000 too interesting (11,800 was the critical level at TARP time...was like a magnet and then repelled repeatedly while Congress dithered for 2 weeks).  Possibly prone to downside surprises for a July-September low?
  • Market is up on vapors and we're going into the seasonally weak period of the year (May to October).  Intel reported good earnings and the market is up after hours.  Tomorrow before the opening JP Morgan reports...will it be up too?  And Google reports on Thursday...up?  Friday is Options Expiration day...so, maybe "Da Boyz" are pumping this up to collect on their call options at a good price...while they are creating a burst of buying (April 15th last IRA contributions) that they can sell their big positions into.......Before something bad over the weekend?  That coupled with the fact that most people are getting "conditioned to buy all dips" by the incessant upmove? 
  • If so, would that be just a shock shakeout like in February 2007 period (check the weekly SP500 chart from 12 APR post) just before the next drive up...Or will it start something else? 
  • NOTE: We are in the 2nd year of the Presidential cycle and good moves often follow lows set in that year...have we seen our 2010 low or is it still in front of us?  Other 2nd years of a presidential term were 2006, 2002, 1998, 1994, 1990, 1986, 1982, 1978, 1974, 1970, etc...I won't continue...you can check them for yourself?  Those lows were often made mid-year (July / August) or later.
  • Again, I dunno.  No one does...or they're not talking like last time (sub-prime is contained?). 
  • Tops often take time to form (5-8 week range) usually making them hard...which if we started topping in a range right here it would take us into mid June.  BUT...sometimes they can be shocks like in July 1998 which was caused by the Russian default and then the busting of Long Term Capital management (hedge fund).  Hmmm...default of a sovereign nation...IMF building crisis resources...just thinking out loud.   
  • Just seems to me that the market is priced for perfection and negative surprises have not been outlawed by government.  At least, not yet.
  • Of course, it could all be nothing, too.  Market has been going up very strongly and could keep going up (check the weekly charts.)  As for me, I just don't like the risk levels.  
  • And, I just don't trust "Da Boyz"!  After all that has occurred, nothing has been fixed and the market still was a rocket shot this past year despite fundamentals...if that doesn't demonstrate the market is rigged by the big players via big, fast and loose money in order to play the retail guys well I just don't know what additional proof you need.
  • All I can say is ... Prepare/review your plan ... and enjoy the warmer weather!

13 April 2010

13 APR 2010, Tuesday


  • That is a horrific chart!  And quite revealing all at the same time.
  • Referencing the graph above, including normal levels of the past (at least 1980's levels), ask yourself the question "If the consumer is 65% of our economy, how long might it be until they reduce debt to a serviceable level at which they might be able to spend and power a true economic recovery again?"  The only spending right now is the government stimulus as people try to reduce their debt.  As the stimulus runs out...what then?
  • Oh yeah, one other thing.  With the current Financial Crisis Commission going on now in Washington, many of "the smartest men in the room" (you know...the guys who were pulling down massive pay and bonuses for performance) are all claiming that no one could have ever seen the housing bubble!!?
  • WTF!!!  Just look at the rate of mortgage debt increase from 2000 to 2007.  Sure seems excessive to me.  Especially considering overall debt loads which might lessen someone's disposable income to...oh, I dunno...feed themselves (always first) and then pay their mortgage?
  • Something was powering the juice for that rocket ride and the regulators were asking nothing?
  • The info is from government sources as you'll see in the footnote.  But I guess Congress and the Fed were happy to keep it rolling as long as they could instead of worrying about any potential blowup.
  • OK...one final thing...these are the folks who want to takeover your healthcare...Trust them! 

12 April 2010

12 APR 2010, Monday


  • Daily keeps working slowly upward.  Smaller and smaller incremental moves.  Hasn't been much to say...except that the market just wants to inhale without any exhaling mixed in for good measure.  And earnings season is upon us again.
  • Weekly is looking like those 2006 and 2007 moves.  Another item of note is that we're getting into the price area of the OCT 2008 breakdown area (blue vertical line).
  • But it is going up
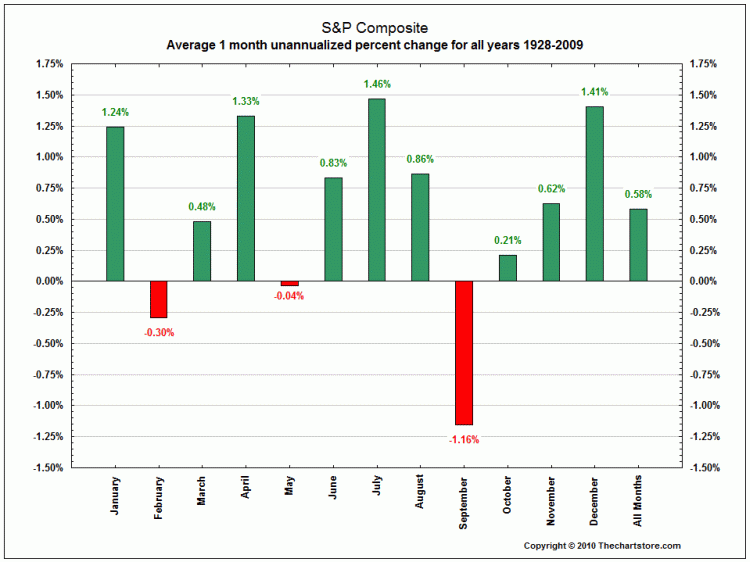
  • Below is just a refresher of monthly seasonality over the past 50 years then since 1928.


10 April 2010

10 APR 2010, Saturday

  • The "Big Con"....absolute classic info...and it is still in place.  I don't trust our financial system.  That's sad to say...but, what has been accomplished in this "you never let a good crisis go to waste"???  I'm finding it diffucult to trust our leadership...sad to say.  Nothing has been fixed that needs to be (1.5 years now) and nothing that caused the "crisis" has been adressed yet....
  • Health care has been crammed down your throat because "It'll reduce deficits!"
  • If so, why are they now (immediately) talking about raising new taxes (ie, VAT, Cap & Trade, etc) even though they are fully aware that the Bush tax cuts expire only 8 months from now???  They are hurrying for a reason...trying to trap the masses that aren't paying attention and have no awareness of reality. 
  • My opinion...both parties are corrupt...and an uneducated, disinterested populace is about to get what it deserves.  Sad to say.  Long live the Oligarchy???
  • Where are the moderates willing to run our government like a business....balancing costs against returns?  Where are the reasonable Americans to demand this?
  • With recent reports that only 47% of individuals pay income tax...compared to 37% in the early 2000's...have we gotten to the point where folks who have no skin in the game can overwhelm the US Treasury by demanding more for nothing?  Is this how democracies die?  We are not a democracy!  We are republic.  Have we lost our way?
  • I'm losing hope...unfortunately, we are being forced into a protect yourself and your family from overreach by politicians with "good intentions".  Hey...maybe they can re-pave some of our roads..."crumbling infrastructure" sound familiar?
  • DON'T lose sight of the big picture...that's what our current leadership is hoping to do...keep us scrambling as they move as quickly as possible to change what the nation we were privileged to grow up in.

06 April 2010

6 APR 2010, Tuesday


  • Can run for awhile...not a time for fresh buys as far as I'm concerned...better for defense

05 April 2010

5 APR 2010, Monday


  • Not much has changed...continues to hold a solidly overbought environment on the daily. 
  • Too high to buy and too strong to sell.
  • Correction...something of note...the chart above shows call vs put buying.  Basically, when you see a high number on the blue line (right side scale) people are buying a lot of calls and thus are very bullish (opposite for bearish).  Black line is SP500 price overlay.  Now compare the option buying extremes to the SP500 price.  Also, note that the last time call buyers were this bullish was OCT 2007.
  • Nothing goes up (or down) in a straight line forever.