skip to main |
skip to sidebar

- Yup! That sure seems about right these days...what the heck is going on!!!
- Below chart is interesting...stock market capitalization vs Gross Domestic Product. Look at the best buy and hold timeframes for a "where we are"?


- Red flags are flying.
- So far the market continues the current upmove as I had described in the 13 APR post videos and my 24 MAY update. But, lately, it's lost a lot of it's upward momentum and is trying to determine direction...it's been UP, now it's going SIDE, next might be...??? Now you know the reason for the blog's name.
- Honestly, noone knows right now as there is a battle being waged for control between the bulls and bears. Currently, they are stalemated as shown by a sideways price zone. From a sideways area you can go up OR down. The point is, when you come out of sideways you are directional again.
- Personally, I would love to see one more push up into the high 900's / low 1,000 area (SP500 980-1020). It would give investors a higher exit price. It would, also, provide me better prices to establish an intermediate short position.
- But, since there is no certainty in the market you just have to pick the risks you want to tolerate. Investors should really be considering sidelines for a few weeks/months, in my opinion. As for the trader in me, it seems that the easier money will be made to the downside for awhile. I'd like to begin taking advantage of current, and any higher, price levels for short sales. I'm thinking that there will be some kind of retest of the March 2009 lows...SP500 666...and the potential for lower...610 (realistic), 480 (possible), 390 (now, that's getting ridiculous but I won't rule it out). Just capturing a portion of that move from current price levels is a good profit. NOTE*** You don't need to catch the top. You don't need to catch the bottom. All you need, is the middle to do well.
- For those of you interested in inverse ETF's, here's some reading for you...on "How to profit in a Bear Market." Use a portion of your account and trade it like any other stock? (Caution...DON'T even think of triple leveraged ETF's...unless you are a day-trader...DON'T! Ask me why and I'll show you how you will blow up, guaranteed! The doubled leverages have similar issues but aren't as magnified and may be appropriate for 3-4 month timeframes.)
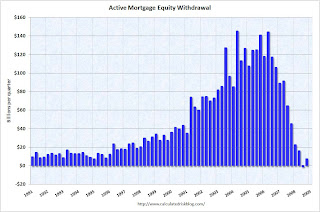
- Above is a chart of Home Equity Withdrawals (ie, 2nd mortgages). (Clicking on pics on the blog makes them bigger.) Now just how many people did that and then spent the money. "Whee! My house is a piggy bank!" Well, all that cash is what fueled the 2003-2007 recovery. But you can see that the "cash out" collapsed in 2007 and there was nothing left to hold our consumption economy up. Now, with housing prices down, the piggy bank is truly empty...but those 2nd mortgages still need to be paid down...or defaulted. Hope those folks enjoyed their toys, vacations, etc.
- Below chart shows the percentage of people who have exhausted their unemployment insurance. Without a jobs generating recovery soon, it appears that there will be even fewer people with some cash in their pocket which will crimp the economy even further. I hope that things can improve soon but the realist in me says that we're in for a long hard road ahead.


- It is exceedingly difficult to convey exactly how much we are spending on all these bailouts. Talking trillions (versus mere billions), and people's eyes glaze over. Humans have a hard time conceptualizing numbers that large. The graphic shows the the total costs to the taxpayer of all the monies spent, lent, consumed, borrowed, printed, guaranteed, assumed or otherwise committed. It is nothing short of astonishing.
It includes the total outlay for all the bailouts to date. In just about one short year (march 2008 - March 2009), the bailouts managed to spend far in excess nearly every major one time expenditure of the USA, including WW2, the moon shot, the New Deal, Iraq, Viet Nam and Korean wars — COMBINED.
206 years versus 12 months. Total cost: ~$15 trillion and counting . . .Un-flipping-believable. - "And what did we get...another day older and deeper in debt...I've sold my soul to the company store." Crikey! At least with the Lousiana Purchase we got ownership of almost half the land mass of the United States.
- Well, this about sums it up better than I could have imagined...a letter writer to the Glenn Beck Show telling our politicians "Both parties are awful...it's time to man up!"

- Starting from a business cycle peak of December 2007, the graphic above is an effort to normalize and rescale the economic data by assigning an index value of 100 to December 2007 numbers for each of the four statistics, so that comparative changes are easier to evaluate. Note that for each series, the average, high and low values are plotted for each month following the prior business cycle high. For industrial production, employment, and real retail sales, the average series includes the 10 recessions starting with the November 1948 business cycle peak. For real income, the average starts with the April 1960 peak.
In terms of conclusions, the current recession is establishing new lows for industrial production, employment and retail sales. Curiously, real income, while low, is not even approaching record lows. Note also that in prior recessions, employment and retail sales have usually started to rebound by now, with real income and industrial production taking longer to bottom.
Going forward, it will be interesting to see how long some of these indicators continue to set record lows and how long before they rebound to the levels of the “average recession".

- The Japan experience...the Nikkei Dow.

- Investment newsletter writers...very few are bearish. Indicates complacency...while not a precise timing indicator, it does give you an idea that potential risks to the downside are increasing.

- Outcome possiblities using historical data after S&P 500 has returned more than 30%.
- These deficits are, historically speaking, absolutely insane! Yet, "Yes We Can" is what President Obama and Congress say to continuing down this road to banana republic land.
- But, thank God, the Bond Vigilantes are saying "No You Can't". Unfortunately, the cost of this market instilling discipline will be much higher interest rates...which, during a recession, will do nothing to help us pull out of the downturn.
- It seems like it's going to be a long hard road to recovery.

- "I'm from the government...and we're here to help!"
- Treasury Secretary Tim Giethner's 'hat-in-hand' begging tour of China has been an embarassing moment for our once proud nation. There was even an article on Bloomberg which told of Geithner speaking to a college class of Chinese business majors and being laughed at when he said "Dollar based assets are sound." Swell! By the way...that article was pulled down not long afterward. Hmm...now that's peculiar.
- Why don't our folks get it??? And more importantly, when will they correct this current nightmare which is getting ready to rev up again.
- This past 3 months has been the calm before the storm...just my opinion...DEFENSE!!!

- Hard to believe...but it's been 20 years since the Tienanman Square Massacre. The good news is it appears that China has come a long way from that point...I hope.
- Ya know...looking at that picture kind of shows what I feel like sometimes trading against "Da Boyz".
- Anatomy of a Crash ... for the finance geeks like me.

- FINA-FREAKING-LY! Let the perp walks begin..."Tan Man" Mozilo charged with Fraud. I sure hope it's just the beginning in the loooonnnggg overdue law enforcement action against all those that have brought our financial system (and the US taxpayer) to its knees.

- And these are the "smart, responsible little people" that we are bailing out....excerpts from a NY Times article and commentary from one of my favorite irate financial bloggers.
- It's really hard to imagine how people like this even manage to breathe without someone there to constantly remind them...Sheesh!
- Oh yeah...and "Boo freaking Hoo!" to all those silly folks. Welcome to the real world of "Survival of the Fittest". Yes, it even applies to the human animal. Sooo, learn your lessons, don't do it again and don't let your family or friends do it either!
- ...And THAT is when America will finally get back on track toward a sound future.
- BREAKING NEWS...TAXPAYER TAKES IT IN 3 DIFFERENT HOLES...
June 3 (Bloomberg) -- JPMorgan Chase & Co., the second- largest U.S. bank by deposits, hired a newly built supertanker to store heating oil off Malta, shipbrokers reported, in the company’s first such booking in at least five years.
The bank hired the Front Queen for nine months, according to daily reports from Oslo-based SeaLeague A/S and Athens-based Optima Shipbrokers Ltd. David Wells, a spokesman for JPMorgan in London, declined to comment.
So let me see if I get this right.
The Taxpayer hands JP Morgan billions of dollars to bail them out and keep them from potentially being declared insolvent.
In return for this JP Morgan spends that money speculating on the price of oil, and in fact does one better - they take physical delivery and lease a ship to store it in, thereby withholding the oil from the market and propping up the price, hoping to be able to sell that oil at a higher price later.
In the meantime, however, they are partially responsible for the rise in gas prices, meaning that not only did they collect taxpayer money once, but they are effectively partly responsible for you the consumer paying a second tax, this time through higher fuel prices at the gas pump.
Then, when the time is right (for them) they will sell the oil and profit a second time.
You, the taxpayer, will pay for all three of these actions.
And we, the idiots in America, along with a bribed and purchased Congress, will allow them to get away with it.


