skip to main |
skip to sidebar

- Government is (ie, spends) twice as big as it was 10 years ago. What have we got for that? A couple of protracted wars, a housing bubble, skyrocketing (7% annual increases) in college tuition costs...and not even a stinking t-shirt.
- Government is (ie, spends) 30% as big as it was since President Obama's inauguration. Because of the recession and unemployment, tax revenues (government income) went down.
- First, we're just spending too much.
- Second, if you were living paycheck to paycheck, would you increase your spending by 30% if you your income was cut by 15%?
- The math says you can't do that for long. And, it's all about the math...not, about what you wish you could do.
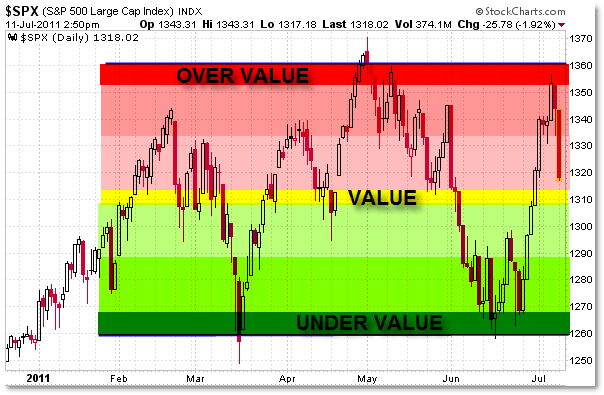
- With yesterday's drop, SP500 currently below all MAs (20/50/90)...risk increases below the 90. Reason, all bear markets go below the 90...BUT, just as a reminder, not all moves below the 90 turn into bear markets. You can check the charts in the sidebar.
- Below, update to the similarities between the current top and that of 2007....very interesting...doesn't have to play out the same but it sure is eerily similar. But, hey, anything can happen...debt ceiling vote saves the day? The news has been non-stop lately...makes it very difficult.

- Who owns all the federal Treasury debt anyway?
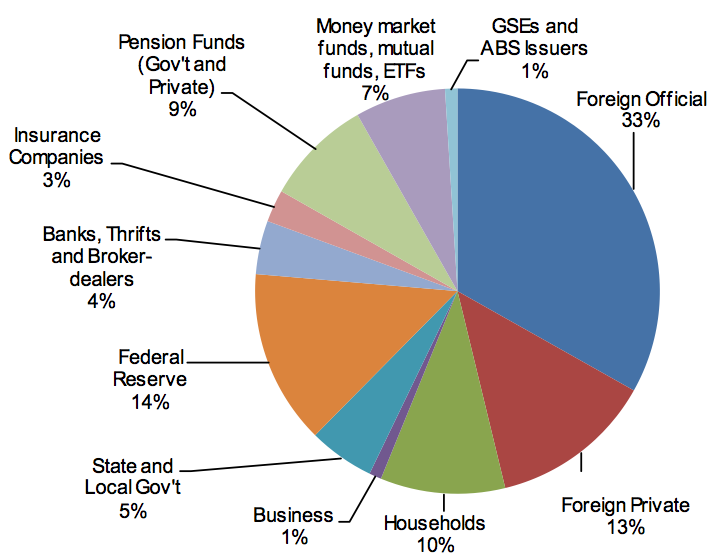
- Where does the big money go? Just wanna highlight...even with several protracted military adventures, what consumes the big percentage? There won't be much of a "peace dividend".

- Kicking the can, kicking the can, we love kicking the can...sing the politicos. It's time to fill that damn can with cement, as far as I'm concerned...let 'em kick it then! If you were running a business, held a meeting with your staff and sensed this stuff...you'd tell them to focus, then lock them in the room until they came out with a truly viable solution! If not, you'd soon be out of business.
- Isn't this the "Theater of the Absurd"?
- News driven market took some damage today.
- Below, interesting graphic on how long you work each day to pay federal taxes.
- Debt ceiling debate continues making markets very erratic due to ongoing uncertainty. Difficult to choose what to do...mostly sitting on hands.
- I sure hope leadership can determine the best course of action with all things considered.
- I, also, hope they finish this soon with no short term solutions.
- There has been enough drama, as far as I'm concerned.
- Lately, been thinking how all the drama reminds me of the TARP Bailout bill. Below, a historical market snapshot, is what happened while waiting for and after the final vote eventually passing it.

- President Bush got this spending behemoth rolling. Current Administration wants to top him!
- Market has been very, very whippy and gappy past week or so. (This morning looks to gap up again.) All the news out of DC and Europe is making this an extremely uncertain environment which is demonstrated in the price action.
- Tough to have any conviction. Only for the bold and very quick.
- Below, Federal spending by the numbers...


- Greece was the word. Now Italy is in the default fray. The Eurozone is cracking and will probably break sometime in the next 12 months seeing a couple of countries leaving the euro.
- Heck...even US debt has been downgraded by ratings agencies in China and Germany. And our very own Moodys ratings agency has put our debt on "credit review" (of course, Moody's rated mortgage backed securities as AAA...ha, ha, ha). And, now Standard and Poors does the same. How many Americans are aware of that???
- Global Debt Clock here...see how nations compare.
- This is making for some very wild moves in the after hours markets. Repeated abrupt moves in both directions leaving little edge.
- Also, US debt ceiling discussions are leading to a lot of uncertainty and markets hate uncertainty as is being demonstrated. Not a good time for big bets until some clarity.
- Markets sitting on 50 & 90 MA's past couple of days...right in the middle of the broad sideways range for since the beginning of the year.
- It's tough to see any direction here. If you look at fundamentals, down would seem to be correct. However, that hasn't worked for the past few years due to QE1 & QE2 (which is sort of over). Which leaves you with technicals which aren't bad just testing nerves. I don't like price beneath the 90MA and will stick with that. The most recent move up was fast and furious. Is this pullback the breather it needs to head back up? We'll see...in time.
- Below...from zerohedge.com, interesting comparison between 2007 top and now...

- Fed Fear Guage???
- I merely put this graph on the monetary base forward for your consideration. What conclusions can we draw from it? Hmmm...you see upward spikes when the Federal Reserve is uncomfortable about what may be coming. For example...
- Notice the blip just before Y2K?
- Then, notice the blip just after 911 in 2001?
- Then, notice the 2008 spike?
- Notice the current spike? What exactly are they afraid of while they're telling us that all is OK???
- Forgive me...I should probably be taking my meds I guess.
- Below, and the silly broad sideways range (mentioned previous post) appears to continue. Now, remember these areas won't be static forever. But they will serve as reference points going forward. Are we just taking a well deserved breather here? Yes. Will it become more? Tough to say. Reminds me of the 2010 summer broad sideways shredder range.
- Interesting...check the charts in the sidebar...since the first of the year we've been trapped in a sideways range. Just a few days ago we were at the lows of that range and now we are back toward the upper level of the range.
- This sets up an interesting question...head and shoulders forming, breakout or just continue sideways? This will not be an easy summer.
- Nothing day yesterday, went nowhere in smallest range in some time. Thus, no new information.
- Hope you all enjoyed the long weekend...I know I did!
- Now...back to work.
- Short term is positive but overbought. Intermediate term is trying to turn up (above all MAs). Confused? Ya oughtta be. That is exactly the spot we are at. Will be trying to determine what my next preference will be.
- Big one way run this past week. Even sprinters need to breathe eventually. Perhaps that's what this will be, a breather, before earnings season kicks off next week. So...correction in price? Or time via a consolidation. Don't know, will have to see what is dealt and play the hand. I do not chase anything. When I have, I have typically regretted it.
- Sooo....will be a slow start to the week for me as I come back out of weekend mode.
- Monthly seasonal below indicates that July is typically a positive month...August and September can be the buggers.


