30 December 2011

30 DEC 2011, Friday

  • Above...US military bases worldwide.  A bit much, I'd say.
  • On a market note...SP500....2010 closing price was 1257.64...2011 closing price was 1257.60.  Don't think that the market is controlled by folks with a sense of humor?  Remember the 666 low for SP500 in MAR09???  Can't get much closer to unchanged than that.
  • Rip Van Winkle would've woke up after this year and said "Gee, I guess nothing happened!" which belies the roller coaster sideways year this was.


29 December 2011

29 DEC 2011, Thursday (AM)

  • Charts worked up by breakpointtrades.com and they were simple and to the point so I credit them and post for reference.
  • Above, all you can say is sloppy sideways...nearing apex of triangles.  Breakout will come, eventually...direction unknown.  But, when it breaks out all the stored energy should provide for a pretty good move.
  • Below, long term weekly chart with various indicators.  Take some time and review it.  There is no "system" but you should review the chart and draw some tools / guides from it for your future use.


25 December 2011

18 December 2011

17 DEC 2011, Saturday

  • Historical interest rates of 30 year US Treasury Bond.


16 December 2011

16 DEC 2011, Friday

  • 1935-1941 was the depths of the Great Depression.  The economy was mired down and did not improve until WWII came along.
  • Look at interest rates from 1935-1941.
  • Now, look at our current interest rates...notice something?  Are we in a Depression?


12 December 2011

11 DEC 2011, Sunday

  • See above for what is quietly happening...Lessening dependence on imported oil!
  • It's good news...why isn't the media really banging this message?
  • Could be one helluva jobs program if we'd just get to it!  Read more here.
  • Some info on fracking for natural gas and oil.
  • Fracking...more info.


11 December 2011

10 DEC 2011, Saturday


09 December 2011

9 DEC 2011, Friday

  • Struggling to find a campaign message this time.
  • Is it OK if we talk about his record this time?  We at least have something to talk about this time.


08 December 2011

8 DEC 2011, Thursday

  • Above, the bothersome facts that the "greenie's" don't want you to be aware of.  
  • Why don't they believe in your right to freedom of choice in what energy source best serves your family and you?
  • Honestly, do you know anyone...anyone???....who wants to pay 2-3 times more for their electric bill?

07 December 2011

7 DEC 2011, Wednesday

  • "A day that will live in infamy."  ...70 years later.


05 December 2011

5 DEC 2011, Monday


  • What a wild ride of a year...and no progress.  It's only been for trading...and tough at that.


02 December 2011

2 DEC 2011, Friday


  • Seems to sum it up!

01 December 2011

1 DEC 2011, Thursday

  • Historical depiction of unemployment.
  • Is sitting killing you?  Below...


21 November 2011

21 NOV 2011, Monday


19 November 2011

19 NOV 2011, Saturday

  • Above...Police in the U.S. dealing with protesters exercising their First Amendment rights of free speech and peaceful assembly as they call out for justice over the past few years of brazen outright corruption supported by the Wall St / Washington cabal over the past few years.  (What percent are you?)
  • Below...And then there's this...how fraud & white collar crime is dealt with in China.
  • Hmmm...perhaps if we had better law enforcement and prosecutions back in 2008, and since, there might not be protests here in the US now???  Perhaps?  Ya think?
  • The way MF Global's Jon Jon Corzine case is handled will be an all important tell as to whether things have changed or if they are just getting worse.
  • Time will tell.


18 NOV 2011, Friday


16 November 2011

16 NOV 2011, Wednesday (AM)

  • Triangle chop (highlighted in yellow) gets tighter and tighter every day.  trapped between 50 and 200 MA's.
  • Potential breakout / breakdown potential highlighted on the far right of chart.
  • It is sideways...resolution could go either way.  It's been a real grind for the past bunch of weeks.


10 November 2011

10 NOV 2011, Thursday

  • Always good for different perspectives.  This fella is a great chartist...you can see his website on the chart.


08 November 2011

8 NOV 2011, Tuesday (AM)

  • Good visual of the "price" being paid by Main Street during this ongoing financial stress.
  • Look at those interest rates!  Anyone reliant upon interest income (ie, retirees) has been devastated with nowhere to turn since stocks are not an appropriate place for them based on risks.  
  • Also, shows the unbelievable effect of QE on and QE off regards the stock market.


03 November 2011

3 NOV 2011, Thursday (AM)

  • The similarities between 2007 and current continue.  
  • Doesn't mean it will continue but it sure is interesting.


01 November 2011

1 NOV 2011, Tuesday (AM)

  • The truth about "Hey, let me help you with that" which politicians don't tell you.
  • They say they'll "give you stuff" to get your votes.  What they don't say is that to give you stuff, they first have to take it from you...just to give it back to you.
  • Why do people fall for the nonsense? 
  • Market?  Seemed overbought to me over the weekend. 

31 October 2011

31 OCT 2011, Halloween

  • Well, well...a Goldman Sucks dude finally got me!
  • MF Global (my brokerage), run by former Goldman Sachs leader and prior NJ Governor...Mr. Corzine, decided that he wanted to get rich quick and played fast and loose with his firm's capital and the law.  Unfortunately, he has wreaked a lot of damage that will probably only become apparent over the next few weeks as MF Global declares bankruptcy and is simultaneously sued by SIPC due to ... let's just say..."de-segregating" segregated accounts.
  • What a freaking cluster-fork!
  • So...I'll be trying to figure out what all this means for myself with the newly created free time from trading that I have while I sort some of this out.  Unbelievable.  
  • Hey...Mr. Corzine...kiss my big, fat orange arse you egomaniac "willing to write checks that you can't cash"!
  • A temporary side-step in life...and eventually as Arnold Schwarzenegger said, "I'll be back"....just not sure how excited I am about posting for myself when there's no reason to for awhile.  
  • Who knows...as the mood strikes.

24 October 2011

24 OCT 2011, Monday (AM)

  • Week of sideways to work off some of the overbought.  But not much.  Above 20/50MA and actually poked above 90 on Friday.  Not much market structure to work with makes it difficult.
  • Europe continues it's incessant back and forth nonsense.  They were supposed to announce on Sunday but then they said "No, now on Wednesday...really!  We hope."  Every time they go to a camera and say what amounts to nothing the market quickly jerks back and forth.
  • Approaching the 1260 pivot lows.  Will be interesting to see if people who bought in the first half of the year and were trapped by August's decline will begin to sell as they start to see more of a breakeven.  Other thing, due to the nature of this rally, most money managers may have been left behind and will now have to scramble to catch up by the end of the year???  Isn't this fun?
  • Trading only still due to volatility and news driven market.  

14 October 2011

14 OCT 2011, Friday (AM)


  • Interesting graphic above regarding duration and extent of historical bear markets for future reference.
  • Below, market is short term overbought.  Due for some consolidation, retracement at least.
  • Honestly, it's in a position where it can do almost anything since there is no real market structure to work from beyond the continued large sideways band.  Only thing going for it is that it's above its 20 & 50MAs.  But, still below the 90 & 200MAs.  The following action will have to provide additional clues.
  • It is very news driven (ie, Europe) and volatile...and, now, it's earnings season as well.  Upcoming news in November will be the debt ceiling again and the Congressional Super Committee findings. 
  • And one final thing to consider, it appears that we are rolling over into a new recession based upon leading indicators and stocks don't tend to do well then.

11 October 2011

11 OCT 2011, Tuesday (AM)

  • Last Wednesday mentioned about the similarities from Spring of 2008 and current timeframe and the possibility of a 1-2 month choppy up move.  Found some charts that better show it from different sites.  Nice when I can find charts already done.
  • Above, chart from etf-corner.com, shows current timeframe on top and 2008 below it.
  • Below from breakpointtrades.com, shows a similar possibility.
  • And for the more bullish case of similarities...click here.  I think conditions are not the same as back then.
  • Of course it doesn't mean that has to happen since the market can do anything at anytime.  What the bulls don't want to see is a break back down out of the range.
  • Anyways...market has streaked straight upward from when it got back into its range (~8.5% in 5 days).  Above it's 20 and 50 (first time since July) MA's.  Short term overbought would expect some pullback in a day or two.  
  • Way at the bottom, from alphatrends.net, recent volatility captured via % change runs.


07 October 2011

7 OCT 2011, Friday

  • From a fella on Twitter, Gann360...a good chartist who always has a knack for seeing things that bypass most of us.
  • Above the similarity between 2007 top and now.
  • Just interesting, doesn't mean it has to play out that way. 
  • Below, employment situation graphics.  Ouch!  Good news at bottom is that private sector job picture is improving.


05 October 2011

5 OCT 2011, Wednesday (PM)

  • Love it!
  • From bespokeinvest.com...
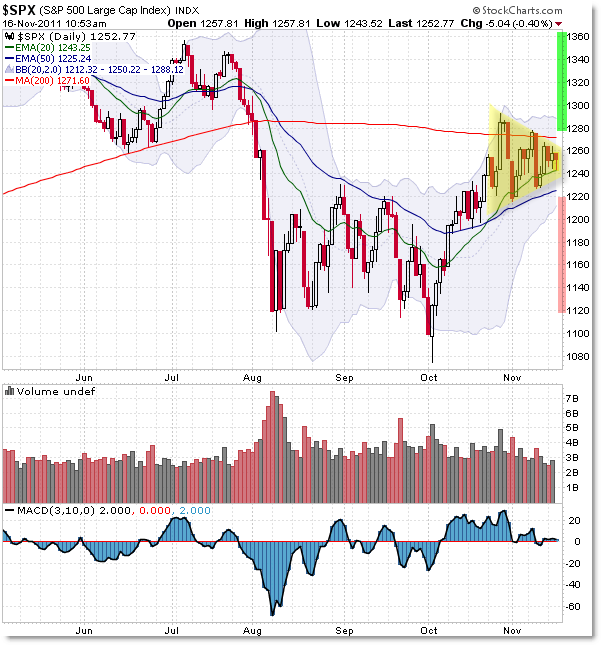
Insane volatility....Up 8.31%. Down 7.34%.  Up 5.34%.  Down 5.68%.  Up 7.38%.  Down 8.70%.  Up 7.34%.  Down 10.14%.  Up 6.65%.
Those are the swings the S&P 500 has seen over the last thirty trading days.  Not that anyone could, but if you had perfectly timed these market moves since August 26th by going long at the lows and short at the highs, you would be up over 90%.  Then again, had you completely mistimed the market over that same time period you would be down more than 50%.  Having fun yet?

  • Steve Jobs...Rest in Peace.

5 OCT 2011, Wednesday (AM)

  • Aaand right back in the range.  What a game.
  • Pretty impressive late day reversal in the congestion band from summer 2010.
  • Perhaps it's trying to find support?  If today's low holds for a few days, maybe we can rally for a month or two back up, dare I say it, to the top of the recent range or even those swing lows in the 1250 area (200MA up there and is coming down).  Had a breakdown like this into MAR 2008 and it went up into MAY right back to it's 200 and failed leading to the nasty 2008 fall.
  • Dunno...all you can do is follow.  I'm not going to be bold...never know what the next headline out of Europe does.  Treacherous markets and the high volatility continues.


04 October 2011

4 OCT 2011, Tuesday (AM)


  • Finally broke out of the sideways range we've been trapped in for weeks...to the downside.  Well below all MA's.
  • Here's an interesting fact...3 OCT 2011 - SP500 closes at 1099.23 and on 3 OCT 2008 it closed at 1099.23 just before the waterfall down of that year.  Coincidence???  Don't believe it?  Chart below...For what it's worth.  
  • Now we're in the summer 2011 sideways zone of 1020-1120.  Waiting to see what kind of support it offers.  Reminding myself that in down markets oversold can become even more oversold and nothing goes in a straight line forever.