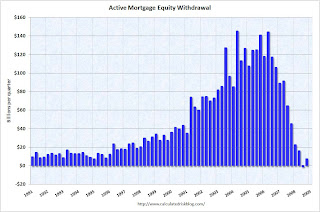
- Above is a chart of Home Equity Withdrawals (ie, 2nd mortgages). (Clicking on pics on the blog makes them bigger.) Now just how many people did that and then spent the money. "Whee! My house is a piggy bank!" Well, all that cash is what fueled the 2003-2007 recovery. But you can see that the "cash out" collapsed in 2007 and there was nothing left to hold our consumption economy up. Now, with housing prices down, the piggy bank is truly empty...but those 2nd mortgages still need to be paid down...or defaulted. Hope those folks enjoyed their toys, vacations, etc.
- Below chart shows the percentage of people who have exhausted their unemployment insurance. Without a jobs generating recovery soon, it appears that there will be even fewer people with some cash in their pocket which will crimp the economy even further. I hope that things can improve soon but the realist in me says that we're in for a long hard road ahead.
7 Things To Buy To Be Happier, According To Neuroscience
-
The pursuit of happiness often leads people down the wrong shopping aisles.
While conventional wisdom suggests that material possessions bring
temporary ...
3 minutes ago


No comments:
Post a Comment