27 April 2010

27 APR 2010, Tuesday


  • Think that Goldman Sachs is trying to tell Congress that "If you mess with us, we'll turn off the HFT computers and the faux rally we engineered this past year is over."  (Or is that yellow trend line exerting influence...twice now.)
  • The 2 vertical orange lines highlight when GS was charged by the SEC and then, today, was hauled before Congress.
  • Coincidence?
  • Also, as warned in the 13 APR post, Greece debt downgraded to junk today.
  • Which is it?  Dunno.  The risk has been high and is looking for triggers...negative surprises.
  • Still up, although starting to appear sideways, didn't break the previous pivot (black line) yet.  Tomorrow, the FED makes its release on interest rates after it's 2 day meet.  Always provides some excitement.  Which way?  Dunno.  Do they save it here and drive it back up?
  • After as strong a run as it has been, it could still go back up again.  Wouldn't surprise but could set up larger divergences.
  • Anyway, I'm watching how this progresses. 

26 APR 2010, Monday

  • This is all pretty simple...why doesn't government see it?
  • In inflation adjusted dollars (so it is an apples to apples comparison), look at the spending trend in government at all levels.  Remember this as you think about the tax hikes passed in the healthcare bill, the upcoming Bush tax cuts expiration and now the talk of more taxes via a VAT and Cap and Trade.
  • It's not that you're taxed too much...it is that we spend too much.  Reduce that and you won't need more taxes.  Simple huh?
  • And if we don't reduce spending (which seems to equal borrowing these days) on our own...as adults in government, then the increased interest costs will force us to.  Either that or we will be reduced to a "new feudalism" where we peasants work for the elite and whatever they desire.
  • I didn't sign up for that and I don't want my kids and grandkids forced into it either.
  • Why is this so difficult?  What am I missing?


25 April 2010

25 APR 2010, Sunday


  • Well...they shrugged off that Goldman shock from last Friday continuing upward to make new highs.  The lift in this market is something to see.  Last time we had 8 straight up weekly closes was NOV 2003-JAN 2004.  Then the market went sideways in a 10% range for most of the year until the fall. 
  • Made it to the 61.8% Fibonaccic retracement (SP 1228...brown line on weekly) where the 200 week moving average is.  Also, it is the bottom of a 2008 congestion area that formed just prior to the collapse.  Will be interesting to see how it handles that broad price band.  
  • Time to rest or is it on a mission?
  • Sentiment by the newsletter writers has gotten very bullish which can be a contrary indicator...but not precise in timing because it can stay that way for awhile.
  • Then there is always the magazine cover as contrary indicator...below, the Barrons bull splat cover came out 9 MAR 2009 (the bottom basically).  This week a bear splat cover.  Will it have similar implications?  The timing is often uncanny...time will tell.
  • It is still going up!  Again...as for me, I don't like the risk for the return potential.  Many indicators are once again at levels that have signalled for caution in the past.  So, I listen to them and play defensively.   

24 APR 2010, Saturday


  • Change?
  • Most Americans agree to help those in true need through temporary hardship.  But where do you draw the line?  Is there a line any longer at all?

18 April 2010

18 APR 2010, Sunday


  • Well, Goldman gets a surprise and the market, too.  Appears that the yellow trendline (from 12 APR post) acted as resistance as well.  At least the market finally exhaled instead of non-stop inhaling.  It's just one day.  Will be interesting to see how it behaves now.
  • A few daily pivot lows to watch for how price reacts for clues.  Will the JAN highs at 1150 act as support is probably the true test.  Seems the 50 & 90 day moving averages will be right about there soon too.
  • Below...banks ...OUCH!


14 April 2010

13 APR 2010, Tuesday (Part 2)

  • Now...either the banks are suddenly lending $400 billion this last week when they haven't been lending for some time OR....the Federal Reserve is preparing money for a bailout...a BIG one!
  • Saw this yesterday at Market Ticker and didn't know what to make of it.  Read the short post here.
  • Then I saw this IMF Press Release tonight...IMF Boosts Resources for Crisis Resolution.
  • It appears that may be where the money went...perhaps.
  • Huh?  Our leadership is telling us all is good...no?  I do not trust any of this crap.  Is it possible for governments to prop up assets worldwide forever? (Read the first 13 APR post below for an opinion)  Crazy stuff....crazy times.  Next shoe to drop?
  • So, is the money for the on again, off again Greece bailout?  Or to bolster the European Union after a Greece failure starts some dominos falling?  Or maybe just some walking around money for the IMF?  Or, I know, I know...China is going to suddenly have a fake implosion and this is how they get their money back from us laundered through the IMF under the guise of a crisis?  Alright, now I'm just getting silly. 
  • I honestly do not know and I honestly do not care.  I am hunkering down and will let not quibble about any remaining nickels or dimes that may be left in this most recent upmove.  It is still strong...but eerily quiet in it's slow drift upward...and very stretched...just as Dow hits 11,000 too interesting (11,800 was the critical level at TARP time...was like a magnet and then repelled repeatedly while Congress dithered for 2 weeks).  Possibly prone to downside surprises for a July-September low?
  • Market is up on vapors and we're going into the seasonally weak period of the year (May to October).  Intel reported good earnings and the market is up after hours.  Tomorrow before the opening JP Morgan reports...will it be up too?  And Google reports on Thursday...up?  Friday is Options Expiration day...so, maybe "Da Boyz" are pumping this up to collect on their call options at a good price...while they are creating a burst of buying (April 15th last IRA contributions) that they can sell their big positions into.......Before something bad over the weekend?  That coupled with the fact that most people are getting "conditioned to buy all dips" by the incessant upmove? 
  • If so, would that be just a shock shakeout like in February 2007 period (check the weekly SP500 chart from 12 APR post) just before the next drive up...Or will it start something else? 
  • NOTE: We are in the 2nd year of the Presidential cycle and good moves often follow lows set in that year...have we seen our 2010 low or is it still in front of us?  Other 2nd years of a presidential term were 2006, 2002, 1998, 1994, 1990, 1986, 1982, 1978, 1974, 1970, etc...I won't continue...you can check them for yourself?  Those lows were often made mid-year (July / August) or later.
  • Again, I dunno.  No one does...or they're not talking like last time (sub-prime is contained?). 
  • Tops often take time to form (5-8 week range) usually making them hard...which if we started topping in a range right here it would take us into mid June.  BUT...sometimes they can be shocks like in July 1998 which was caused by the Russian default and then the busting of Long Term Capital management (hedge fund).  Hmmm...default of a sovereign nation...IMF building crisis resources...just thinking out loud.   
  • Just seems to me that the market is priced for perfection and negative surprises have not been outlawed by government.  At least, not yet.
  • Of course, it could all be nothing, too.  Market has been going up very strongly and could keep going up (check the weekly charts.)  As for me, I just don't like the risk levels.  
  • And, I just don't trust "Da Boyz"!  After all that has occurred, nothing has been fixed and the market still was a rocket shot this past year despite fundamentals...if that doesn't demonstrate the market is rigged by the big players via big, fast and loose money in order to play the retail guys well I just don't know what additional proof you need.
  • All I can say is ... Prepare/review your plan ... and enjoy the warmer weather!

13 April 2010

13 APR 2010, Tuesday


  • That is a horrific chart!  And quite revealing all at the same time.
  • Referencing the graph above, including normal levels of the past (at least 1980's levels), ask yourself the question "If the consumer is 65% of our economy, how long might it be until they reduce debt to a serviceable level at which they might be able to spend and power a true economic recovery again?"  The only spending right now is the government stimulus as people try to reduce their debt.  As the stimulus runs out...what then?
  • Oh yeah, one other thing.  With the current Financial Crisis Commission going on now in Washington, many of "the smartest men in the room" (you know...the guys who were pulling down massive pay and bonuses for performance) are all claiming that no one could have ever seen the housing bubble!!?
  • WTF!!!  Just look at the rate of mortgage debt increase from 2000 to 2007.  Sure seems excessive to me.  Especially considering overall debt loads which might lessen someone's disposable income to...oh, I dunno...feed themselves (always first) and then pay their mortgage?
  • Something was powering the juice for that rocket ride and the regulators were asking nothing?
  • The info is from government sources as you'll see in the footnote.  But I guess Congress and the Fed were happy to keep it rolling as long as they could instead of worrying about any potential blowup.
  • OK...one final thing...these are the folks who want to takeover your healthcare...Trust them! 

12 April 2010

12 APR 2010, Monday


  • Daily keeps working slowly upward.  Smaller and smaller incremental moves.  Hasn't been much to say...except that the market just wants to inhale without any exhaling mixed in for good measure.  And earnings season is upon us again.
  • Weekly is looking like those 2006 and 2007 moves.  Another item of note is that we're getting into the price area of the OCT 2008 breakdown area (blue vertical line).
  • But it is going up
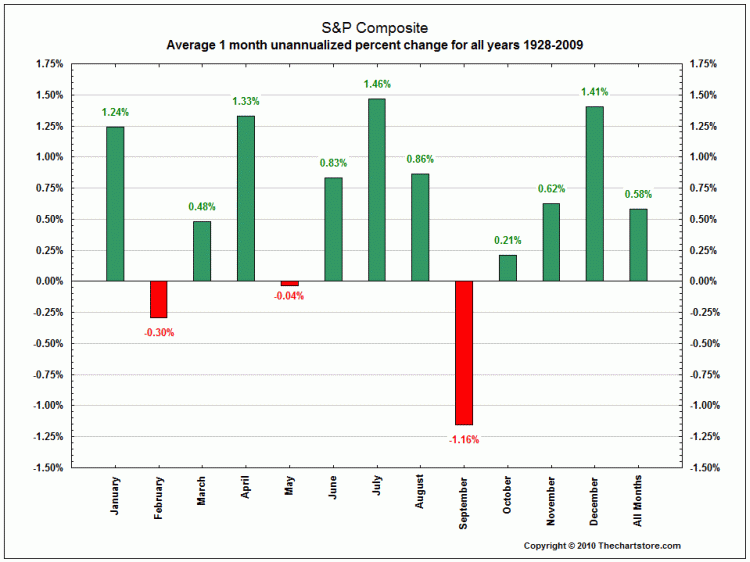
  • Below is just a refresher of monthly seasonality over the past 50 years then since 1928.


10 April 2010

10 APR 2010, Saturday

  • The "Big Con"....absolute classic info...and it is still in place.  I don't trust our financial system.  That's sad to say...but, what has been accomplished in this "you never let a good crisis go to waste"???  I'm finding it diffucult to trust our leadership...sad to say.  Nothing has been fixed that needs to be (1.5 years now) and nothing that caused the "crisis" has been adressed yet....
  • Health care has been crammed down your throat because "It'll reduce deficits!"
  • If so, why are they now (immediately) talking about raising new taxes (ie, VAT, Cap & Trade, etc) even though they are fully aware that the Bush tax cuts expire only 8 months from now???  They are hurrying for a reason...trying to trap the masses that aren't paying attention and have no awareness of reality. 
  • My opinion...both parties are corrupt...and an uneducated, disinterested populace is about to get what it deserves.  Sad to say.  Long live the Oligarchy???
  • Where are the moderates willing to run our government like a business....balancing costs against returns?  Where are the reasonable Americans to demand this?
  • With recent reports that only 47% of individuals pay income tax...compared to 37% in the early 2000's...have we gotten to the point where folks who have no skin in the game can overwhelm the US Treasury by demanding more for nothing?  Is this how democracies die?  We are not a democracy!  We are republic.  Have we lost our way?
  • I'm losing hope...unfortunately, we are being forced into a protect yourself and your family from overreach by politicians with "good intentions".  Hey...maybe they can re-pave some of our roads..."crumbling infrastructure" sound familiar?
  • DON'T lose sight of the big picture...that's what our current leadership is hoping to do...keep us scrambling as they move as quickly as possible to change what the nation we were privileged to grow up in.

06 April 2010

6 APR 2010, Tuesday


  • Can run for awhile...not a time for fresh buys as far as I'm concerned...better for defense

05 April 2010

5 APR 2010, Monday


  • Not much has changed...continues to hold a solidly overbought environment on the daily. 
  • Too high to buy and too strong to sell.
  • Correction...something of note...the chart above shows call vs put buying.  Basically, when you see a high number on the blue line (right side scale) people are buying a lot of calls and thus are very bullish (opposite for bearish).  Black line is SP500 price overlay.  Now compare the option buying extremes to the SP500 price.  Also, note that the last time call buyers were this bullish was OCT 2007.
  • Nothing goes up (or down) in a straight line forever.

28 March 2010

28 MAR 2010, Sunday

Lengthy Long Term Overview today to re-cage (remind) my gyros and collect the thoughts that have been running through my mind lately.  Rambling overview first then current thoughts / discussion of psychology toward the bottom for longer term folks.

Let's begin:  Research...


  • Still believe that we are in a Secular Bear Market (~17yrs long).  Similar times are highlighted by the red lined "flats" in the Dow long term chart at top of this series.
  • We will probably experience a few cyclical bulls and bears within it.  Above, are a zoomed in look at two of those Secular Bears (the flats) so you can compare history to now (bottom of group). 
  • Sooo, the good news?  Perhaps we're halfway?  Perhaps we'll hold the flat?  


  • Of course, we'd all prefer not to see the other type of Secular Bear...the downer (above).


  • Stock valuations as measured by Price to Earnings ratio never really got to solidly undervalued areas as has occurred in each Secular Bear of the past.  When they do, that is the "set-up" for the next "buy and hold" Secular Bull Market.


  • The only other time the 1-year change for the S&P 500 has been higher than it is now was in the 1930s. Unless the market takes off from here even faster than it did in the weeks after the March 2009 lows, 68% will likely be the peak reading of this cycle. (This doesn't mean we've reached a bull market peak, just that we likely won't see the speed of the recent move...another 12-month reading of more than 68% during this bull.  If we do...and you are fortunate to ride it...you buy lunch next time we get together!)

  • For the economy to move forward in a real manner vice this current government debt explosion "delay and pray" economy, it is typically led by a pick-up in either housing or autos (or both) because these are big ticket items which are usually leveraged purchases via loans which provide a money multiplier effect to the economy. 
  • Cash for Clunkers is over and the First Timers Housing Assist is over end of April.  The government throwing free money (well, your tax dollars anyway) at these industries is ending and it was a huge part of the liquidity pump that has held things together since 2009. 
  • Another money pump into the economy was the purchase of gobs and gobs of Mortgage Backed Securities by the Federal Reserve...which ends end of March. 
  • Not to even mention that the Stimulus Act is past its peak and will be winding down over the next few months...the spending was conveniently scheduled to extend right toward the mid-term elections.  My, my...what a coincidence! 
  • The fire hose of money into the economy is being turned off.  Is the consumer ready to step up to the plate and create real demand vice these artificial props that have been in place this past year?
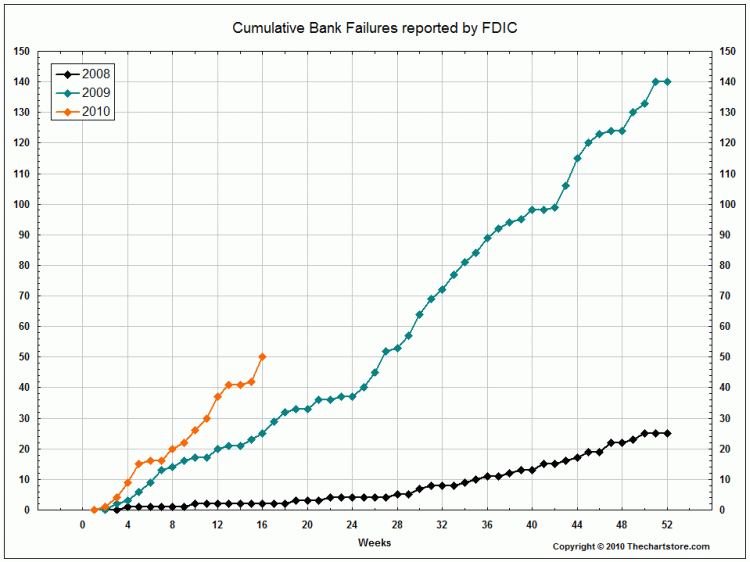
  • By the way, for grins...the chart above is the inflation adjusted median housing price.  It seems that anyone purchasing the median home since 1998 is either breakeven or negative equity.  That coupled with all those folks who took out second mortgages to buy the car, vacation or SkiDoo and that's a lot of money that just vapored yet the debt remains to be serviced.  My guess, most people won't be able to service it and fall to foreclosure (especially due to stubbornly high unemployment)...more hits to consumer balance sheet and bank balance sheets coming (banks currently failing at twice the rate as last year).  So, in my opinion, consumer has no money to spend and banks will be in no shape to lend to consumers who are in no shape to borrow...means little potential for real consumer demand to do its normal thing to make the economy go.     

  • The money hoses are being turned off and now the money vacuums are slowly being turned on and aimed, by the government, into the coffers of corporations and pockets of taxpayers which will draw liquidity out of the private economy....
  • Healthcare approved...Cap and Trade comeback attempt next?
  • Remember...Bush tax cuts expire in JAN 2011 even if Congress does nothing...but the current leadership is still offering new tax initiatives on top of this.
  • Interest rates have been going upward and Treasury auctions are starting to experience failures (ie, low demand for US debt...not good if we intend to try and keep running annual trillion dollar deficits...but I'm sure the Obama team has that all figured out...Right?).
  • The game has changed significantly. Higher taxes and uncertainty are back. And that is likely to translate into market volatility, especially after a twelve month rally in stocks that brought prices back some 70-plus percent from the March 2009 bottom.
  • Although, you wouldn't know it from the recent accelerated upmove highlighted below.


  • OK...so how long does the recent levitation act last? Normal market? Yeah...not so much. Goldman Sachs HFT computers hard at work! All I want is a little market normalcy..."You can't always get what you want but if you try sometimes, you just might find, you get what you need." And right now, this market needs to exhale instead of just non-stop inhaling...for a few days at least.
  • Go to the sidebar for the SP500 daily and weekly charts and review indicator placement to times in the past. 
  • Earnings season is coming up starting mid-April.  Do Da Boyz sell into reports? Take 'em out back and shoot 'em...like they did in January (but then brought 'em back up)?
  • Seasonality calls for November-April as the market's good times while May-October are usually rougher sledding.  Noted...these are guide lines but something to be aware of.
  • Even more daunting is what are the possible unanticipated changes that may spring their traps ahead?  Will the Financial Accounting Standards Board grow a spine and go back to requiring mark-to-market vice mark-to-make-believe?  Will oil spike even further...it's doubled from it's $35 bottom last year.  Will the bond vigilantes turn away from absorbing so much US debt and force fiscal discipline upon Washington DC?  Do European country blow-ups domino toward the US?
  • Aaaahhh, if we only knew all the unknowns...and their timing...and their affect...BONUS!
  • But, as always, its best to be cautious when caution is required...we will look back to these years as truly historic times.  Disruptive change takes time to work through but we eventually get to the "new normal".

  • Market has been up with no real pauses since early February but is starting to slow recently.  Ordinarily, one could expect a 2-3 week consolidation or retrace followed by new highs.
  • But now to some rambling thoughts....(by the way, the SP daily chart found in the sidebar to the right is a stockcharts.com chart which is basically the same as the above chart which is just from my eSignal charting software)...on to those rambling thoughts now...............
  • So, questions I ask myself...What have we got left to the upside after a 77% rise in one year?  Is the SP500 1180 area it?  Another 5% to 1225 area?  Another 35% to new all time highs (1576)?  Or a healthy retracement of this upmove since last year toward mid to low 900's?  Fact is that noone knows.  It's your call, no one else's, since they are your chips on the table...Place your bets and take your chances.  Put all the chips up?  Put only some fraction of the chips up?  Or take the chips off the table and sit patiently waiting for better odds.  Questions all must ask and answer for themselves based upon their individual circumstances and risk tolerance.  
  • All I can say is history shows that in a Secular Bear, at some point you have to find peace at some profit level chosen by you and just take them and then patiently wait for your next opportunity.  Otherwise you risk giving much of it back in any down move (reference the opening series of charts).  It's always much easier to be wishing you were in then wishing you were out.      
  • For longer term investors, some potential guides...be alert when price closes below the 50DMA (red line) and consider throwing the bums out below the 90DMA (green line).  (Or use obvious overbought up moves to reduce exposure / risk since you can always re-add after dips if you like.)  When it comes to the 90/50 moving averages, I get especially observant at the midpoint between those 2 moving averages as that area often acts as support / resistance.  Right now, they happen to be pretty darn close to one another at the 1115 area. 
  • I don't need to sell the top or buy the bottom to make decent returns for what I risk.  Just need to take a chunk out of the middle.  Some prefer to exit as the market is moving in their direction while others prefer to wait for it turn and come back some distance against them.  There is no right answer all the time...it just comes down to personal preference. 
  • Yup, what better time to consider taking profits / reducing risk than when no one is sure as to what's next, except that the government is about to take more money away from the citizens in order to finance an expansion of the already stressed and overpriced social network..."Party Time!!!" 
  • As for me the trader...it's been nothing but trading this month, and very little at that, because there have been few clean "price resets" in the upmove since the February low.  I am very leery of the way this market is being pushed up on low volume in a hurry (but I, admittedly, have been saying that since October of last year...no volume, no fundamentals...blah, blah, blah...no kidding...LOL!).  Those types of moves can be quickly retraced.  Another thing that gives me the creeps is that it has the same feel and pace as mid 2007 and similar indicator extremes for now. 
  • But trading is more to my liking as I prefer taking my share and not necessarily yours and his and hers and that guy's over there too.  Just mine then reduce risk and wait.  I prefer using this...


  • ...as opposed to this.


27 March 2010

27 MAR 2010, Saturday

  1. Environmentalist groups and celebrities are celebrating “Earth Hour” tonight. They ask that you turn your lights out for an hour between 8:30 and 9:30 tonight, to call attention to global warming.
  2. And I say..."Screw that!  I'm turning on my lights, going to watch a DVD on my DVD player and television, will probably do a few loads of wash and will cap it off by using my electric toothbrush before going to bed."  It's been a long cold winter and I see it as my responsibity, as a caring person, to contribute to global warming so that we can get the growing season going ASAP so that we can feed all the extra people whose lives have been saved by President Obama merely signing a bill into law....as he said "So many have died because they didn't have health care insurance."  And, that logic extended to its obvious conclusion means that now since everyone has health care...WAIT FOR IT...WAIT...no one will die!  Ever, I guess.  Sheesh!  That is some change indeed....I should have never have underestimated the power.
  3. Back to turning out the lights...Naah...I figure that North Korea covers me every night.
  4. Arctic Ice Formation extent....

25 March 2010

25 MAR 2010, Thursday


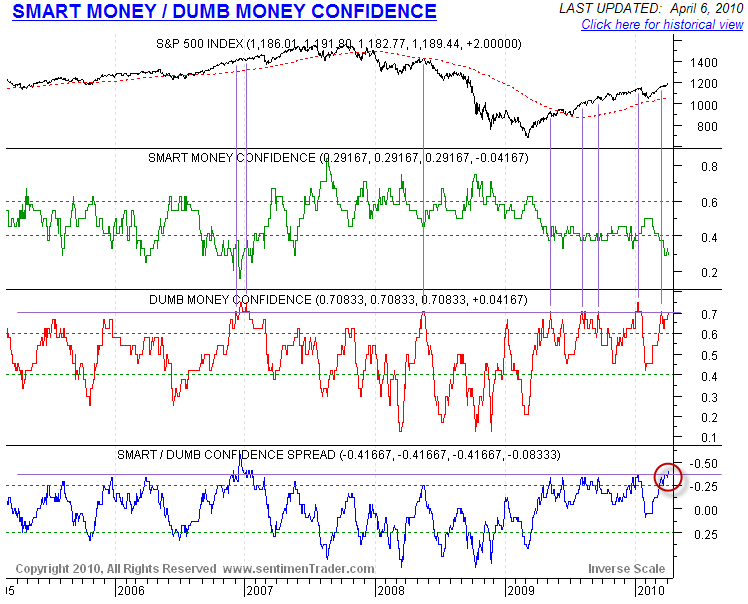
  1. Seems that sentiment is getting a bit lopsided as can be seen from the above chart.
  2. Also, you can check the Sentiment links in the sidebar at the right which show a similar picture.
  3. Sentiment is not a precise timing tool because it can go on for awhile (review the past swings) but it does highlight potential risk of environment.
  4. Now we get to the ugly Truth: The mortgage mods and foreclosure abatement programs are really all about propping up insolvent banking institutions on the taxpayer dollar and at the expense of the middle class.  Good read. 


24 March 2010

24 MAR 2010, Wednesday

  1. Hasn't been much to say lately...a couple of reasons...
  2. First, we're not seeing the speed (ie, percentage moves) that we saw last year and...
  3. Second, it's up too high to buy and too firm to sell.
  4. It'll change....One day at a time.
  5. Below...After trading down nearly $10 earlier in the day, shares of GOOG have reversed and rallied back to the unchanged level. As shown in the Bloomberg chart below, it seems that at least part of the rebound has been spurred by a single trade of 975K shares done at 1:11PM. Block trades of close to a million shares are rare enough, but trades of a million shares for a $500 stock? Unheard of! That single trade in GOOG was worth over $530 million.  Pocket change for....???

22 March 2010

22 MAR 2010, Monday


  1. Coincidence for history buffs....nationalized health care and....??? 
  2. On this day in history the Stamp Act was passed by the British Parliament on March 22, 1765.  The actual cost of the Stamp Act was relatively small. What made the law so offensive to the colonists was not so much its immediate cost but the standard it seemed to set.  The Stamp Act was viewed as a direct attempt by England to raise money in the colonies without the approval of the colonial legislatures.
  3. Representation?  Hmmm...let's do a slight review:  1) TARP - people overwhelmingly said "No!"...passed anyway,  2)  Stimulus - people overwhelmingly said "No!"...passed anyway, 3)  Cap and Trade - people overwhelmingly said "No!"...didn't pass...but they'll turn back to that next, and now 4) Healthcare - people overwhelmingly said "No!"...passed anyway.  To me...I see a pattern.  But, that's just me and my opinion.  And, God knows I've been wrong in the past and, with certainty, will continue to be wrong in the future.  I hope people start remembering that along with our rights, in this republic of ours, we also have responsibilities as the "the Fourth Branch of Government." 
  4. Al Sharpton admits Obama = Socialism .... brief video.  And here's a reminder of what that means to some.

17 March 2010

17 MAR 2010, Wednesday


  1. Bulls still moving the market upward.  Closes well above 90 and 50DMA's which is a good sign but... 
  2. Extended...seeking better odds...notice black lines highlighting similar areas on RSI (purple indicator).

15 March 2010

15 MAR 2010, Monday


  1. Historically, this SP500 1150 area has been significant. 
  2. NOW FASB Wants To Do The Right Thing and move away from mark-to-make-believe accounting?  Uh oh...Be aware of stuff going on behind the scenes...This could be a potential harmful catalyst to the past year's rise in every asset class...this is the bullshirt that is quietly going on in the background and ought to outrage or, at the very least, scare the heck outta any investor because there is no way to realistically determine a true value for any of his investments.  Government funding has kept all the plates spinning but consumer demand has yet to come back.  What happens when the stimulus spending slows?  What else will be able to prop up assets?
  3. As to today's action....With no down days since February, the S&P 500 tracking ETF (SPY) is now riding a twelve-day winning streak. Since SPY began trading in 1993, the only other period where the ETF had a twelve-day winning streak was back in September 1995.  Hmmm...due for a pullback...a little overbought?  I'm a broken record I guess.
  4. The thing that disturbs me is when you get these non-stop eeky squeaky up moves but they are really small incremental gains.  The only thing they do is get media attention..."Another up day!"  Saw the same pattern into the 2007 top which gets my attention.

12 March 2010

12 MAR 2010, Friday

  1. Secular bear market in bonds (rising interest rates) coming...from Martin Pring.
  2. Nancy Pelosi....the single best reason to pray daily for the good health of Barack Obama and Joe Biden!
  3. And...one of my all time favorites...Listen to Senator Harry Reid tie himself into knots as he defends the ridiculous notion of how our tax system is voluntary.  So remember that when the young adults you know get hit with the upcoming (if it passes) "You don't have healthcare tax penalty".
  4. President Obama's "bold" budget slashing proposals...visualized via a few short videos.  Republicans were no better...Medicare Part D anyone?  In February alone, the official U.S. federal deficit was a monstrous $221 billion, far greater than anything we have ever experienced in history.  Remember when the Reagan annual deficits of $200 billion plus seemed insane??? 
  5. Feels to me as if we have finally gone through the "point of no return" with the current US fiscal experiment (Federal Reserve pumping and federal government "permanent" free for all spending).  Noone knows how this grand, first time tried in history, experiment is going to end...no one.  We're trying out theories and hoping for the best.  Regarding CON-gress, Keynes was the government deficit spending proponent....Psst...that didn't work during the Great Depression either...took World War II to make the difference.  Regarding Bernanke, he's treating the market as if it is a machine that has well defined gears, cogs, springs and levers which respond predictably to certain input actions (regardless how radical)...he forgets that markets are made of people that respond in unpredictable ways to stress, fears and uncertainty.
  6. As Tom Petty once sang, "The waiting is the hardest part."
  7. For the layman...Lehman investigation is finally completed.  Please....where are the cops???

11 March 2010

11 MAR 2010, Thursday

  1. SP500 keeps it's upward streak going.  Gotten to the old highs...in a relative straight line, too, which keeps it overbought in my mind.  I prefer to buy dips in bull markets or sell rallies in bear markets...so no action for me.  What will they do with this double top?  Top it or just blast through?  Many are watching. 
  2. Light reading...Lehman investigation indicates that the regulators (ie, SEC and FED) knew of Lehman book cooking fraud months before Lehman went KABOOM!  They just elected to look the other way.  Swell...orange jumpsuits and a good long stay in the Gray-bar Hotel for all involved!  as for current environment, how many other institutions are in as bad a shape now (still) since CON-gress bludgeoned FASB into moving away from mark-to-market accounting and toward mark-to-whatever-we-need-it-to-be accounting last MAR 2009.

09 March 2010

9 MAR 2010, Tuesday


  1. Today is one-year the anniversary of the S&P 500 recovery following its ominous 666 intraday low on March 9th 2009. What comes next? Will the market turn resistance into support and rally higher? Take a breather? Or consolidate sideways? Only time will tell. But the proximity of these trend lines makes for some technical excitement.
  2. Below...speaking of birthdays...The other big date is the anniversary of the Dot.com, telecom and tech bubble. That peaked on 10 MAR 2000 at 5,132.52. Nasdaq bottomed 31 months later at 1,108.49 on 10 OCT 2002...it had lost 78% of its 2000 peak value.  The 1929 Dow comparison is pretty interesting...well, to me anyway.  We're approaching Point 5?  I tend to think that eventually the actual fundamentals of our current disfunctional finance system / economy will catch up to us...you can only "delay and pray" for so long...the timing of the "when we rollover" is always the difficult question without tomorrow's Wall Street Journal on hand.
  3. Regarding today's SP500...price recently upward (still overbought)...wrestling with the JAN high area...anticipate some chop in this area while the bull bear struggle gets decided.


08 March 2010

8 MAR 2010, Monday


  1. Whaddya lookin' at me for???  Check the SP500 Daily chart in the sidebar.
  2. Really not much to say....nothing has changed...up price action recently but overbought.
  3. Today's range is the smallest since NOV 2006 after a quick scan of prices.  No one was trading...felt like everyone was standing in a circle with that "You go first...no you go first" mentality.

07 March 2010

7 MAR 2010, Sunday

  1. You can check the SP500 1 yr daily chart in the sidebar. 
  2. Bulls had an upward burst on Friday after 3 days of chop.  They needed it. 
  3. Upmove from early FEB seems to be getting stretched / overbought just as price is entering the overhead resistance area of the JAN highs.  Will be interesting to see how this area is handled.
  4. Technically, trend is up with closes above the 90 & 50DMA's.

03 March 2010

3 MAR 2010, Wednesday


  1. Goldman Sachs’ trading profits set record!
  2. The latest SEC filing from Goldman Sachs shows that in 2009 the firm made more than $100 million in one day on 131 days (250 trading days in a year). That’s an average of about every other day. It lost money on only 19 days, and Goldman reported that none of the losses on losing days exceeded $100 million. (For the year the firm reported earnings of $13.4 billion from all sources).  Must be easy to make money at an almost guaranteed rate when you're provided with unlimited cash and leverage (ie, fuel) via the Federal Reserve.  I gotta get me some of that...LOL!
  3. Last year’s trading performance broke its previous record, set in 2008 (when the bottom was dropping out of the financial sector, and the financial system was close to total collapse). In 2008 Goldman Sachs made more than $100 million in one day on 90 days.
  4. Ah yes, but these financial firms advise public investors to just buy and hold because the market cannot be timed and too much trading ruins performance.
  5. The obvious question???  How many clients saw gains at that rate???
  6. Today's SP?  You can check the 1 Yr Daily chart from the sidebar at the right.  Second day in a row of higher prices during the day but sells off into the close.  Basically, going nowhere...monthly Employment report is Friday...perhaps waiting for that?  Dunno.
  7. If the Bulls want to own this market, they had better get it moving upward with some energy.  Wouldn't take much of a downside move for the Bears to regain control.
  8. Still day trading in this "decision area"...One day at a time!!!

02 March 2010

2 MAR 2010, Tuesday


  1. Take a look at the above chart.  Now...ask the obvious question..."How come I'm sending my tax dollars to Washington so that they can cycle through a bloated bureaucracy and then just be sent back to my state?"  What the hell is the purpose?  I mean...besides power and control by a too strong central government both over its states and its people?
  2. Now just imagine if the federal government reduced it's meddling in everything and returned to just taking care of its responsibilities specifically detailed in the Constitution.  Then, our federal taxes and federal employment would shrink, return those tax dollars to the state (ie, let them collect them outright) with the responsibility over choice of spending initiatives where the local populace can better hold their legislators to account.  Then, for example, I wouldn't have some chuckleheaded Nancy Pelosi from California or Harry Reid from Nevada dictating what they think is best for Virginia.  Especially, when California is as jacked up as it is...Virginians don't need that kind of "help".
  3. The 10th Ammendment to the Constitution...State's Rights...needs to be asserted by the individual states.  The federal government has grabbed way too much power over time and it is time for it to stop.  Especially, as our leaders demonstrate they don't give a good gosh darn what we think about particular legislation and that we should just shut up and watch some more American Idol because we're just too stupid to understand what's best for us.
  4. Our country was great and can once again restore itself, if we get to it and restore the Constitution to its rightful position as the law of the land instead of "Oh, that old thing?  It's so outdated and useless."
  5. Dunno 'bout that...seems to me that it is what made this country what it is over a few centuries. 
  6. About SP500...tending upward but could turn this back down quickly as well.  Very sketchy area...sticking to day trading here. 
  7. Something to consider...we're almost 1 year from the MAR 09 bottom.  What's the significance of that? Taxes...those who hold an asset 1 year or greater get a much more favorable "long term" capital gains rate coupled with the CON-gress threatening to raise capital gains tax rates for 2010.  Will that bring some selling pressure?  Possible...who knows.
  8. I'm just following price....One day at a time!
 

01 March 2010

1 MAR 2010, Monday

  1. It's a new month and there are new opportunities out there...the hunt starts again...all over!
  2. Regarding "credit contraction" discussed in yesterday's post...here are some charts courtesy of Mish.
  3. SP500 gets an up day breaking above both the 90 & 50DMA's.  This thing may be healing itself.  But since very short term it's overbought, I'm in "show me" mode.  Patience is what is called for now unless doing intraday "hit and runs".  Besides...price has basically gone sideways since mid-October.

28 February 2010

28 FEB 2010, Sunday


  1. Above chart from John Hussman (http://www.hussmanfunds.com/rsi/yieldsinflation.htm).  It plots the historical monthly Volatility of Inflation (consumer price index) against the Price / Earnings ratio of the stock market.
  2. Basically, higher inflation volatility tends to create investor uncertainty which leads them to reduce (sell) stock exposure resulting in lower stock prices (P/E ratio).  Makes sense right?  Heck, if you blur your vision a little you'll see that the relattionship tends to behave in a well contained "L" type curve.
  3. But six data points stand out as unusual (even if they weren't colored red).  And those points just happen to be the most recent 6 months of data.  
  4. I only post this as another demonstration of how we are not in normal times at all.  Those "errant data points" indicate a sort of "No Man's Land".  Perhaps indicative of the past 2 years of FED pumping???  Interesting!
  5. This weekend I mulled over a lot and I think it largely comes down to the answer to this question, "Which will be the influence on our economy going forward for the foreseeable future: deflation or inflation?"  The answer (and timing) holds the key to investment success over the next 5-7 years.
  6. Many think inflation because:  1) the Fed has printed a ton of money and 2) we always have inflation when that happens...no?  Yes, it has worked that way for most of our memories but that is definitely not the way it always works.  Sometimes, unforeseen shocks can overwhelm situations that would ordinarily have very predictable outcomes.  For example: what if the Greece implodes and the Euro is perceived as in jeopardy...enough so that people seeking safety rush into the US Dollar.  Pssst....stronger dollar is not inflationary.  Who knows...just an example.
  7. At the risk of saying "this time's different"...I still lean toward deflation.  Reasons:  1) credit expansion / loans were not backed by true value only "hoped for" value, 2) loans on banks books are currently underwater and will get worse (FED/Congress bought time but things have gotten worse), 3) deteriorating banks will seek to maintain loss reserves which will prevent them from lending to anyone except the US Treasury (now you know who's buying all the bonds...you are or at least your bank is with your money), 4) individual consumers and businesses don't want to borrow even if they could right now due to economic uncertainty and current debt servicing burdens, 5) taxpayers will not support additional federal stimulus and 6) states / municipalities can't print money, will no longer pray for federal stimulus and instead will actually have to cut spending or raise taxes but both take money out of the system. 
  8. As "in system" credit shrinks there is less money and fewer buyers willing to bid for assets.  Prices have nothing left to do but fall...eventually seeking a level at which buyers are sufficiently interested to bid aggressively enough to finally put a price floor in.
  9. Just a thought for a Sunday.
  10. As to current action...choppy, sloppy go nowhere week (click the SP500 1Yr Daily on sidebar).
  11. But at least we have some tighter pivots to watch at 1112 and 1086.  Let's see what happens this week.